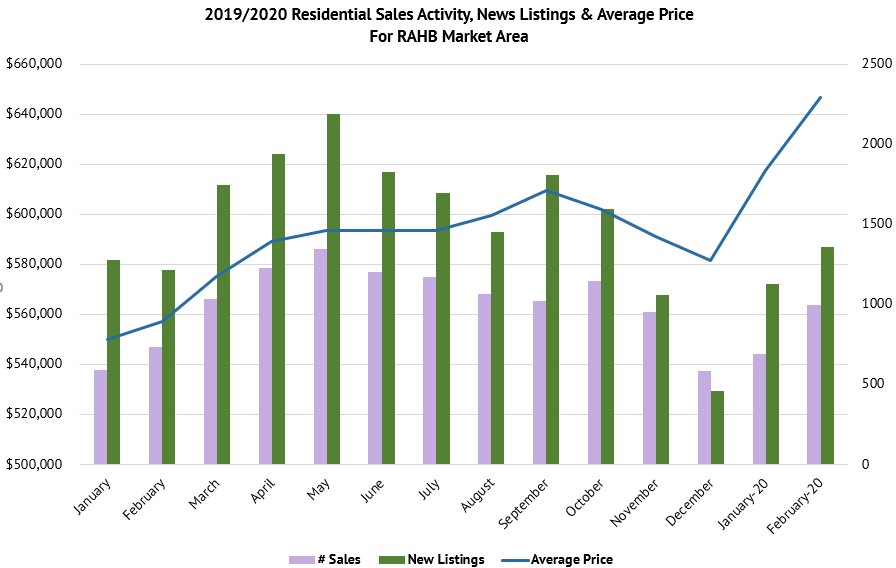
Hamilton, ON (March 3, 2020) – The REALTORS® Association of Hamilton-Burlington (RAHB) reported 998 sales of residential properties located within the RAHB market area were processed through the Multiple Listing Service® (MLS®) System in February 2020. Sales are up 30 per cent over last month and up 25.5 per cent over February 2019. The average price for residential properties increased to $646,667, which is up 4.5 per cent from last month and up 15.5 per cent from the same month last year.
“The RAHB market is quite active with a significant increase in number of sales compared to last month and last year. We experienced similar activity at the beginning of 2016, which was one of our busiest markets on record,” says RAHB President Kathy Della-Nebbia. “With the increases in average price and new listings, overall we are firmly in a seller’s market; however, there is greater demand at certain price points – such as below $600,000.”
The number of sales for single family properties within the entire RAHB market increased by 27 per cent compared to the same month last year, and the average sale price increased by 16 per cent. Townhouse sales activity across the entire RAHB market area increased from February 2019 by 21.2 per cent, and the average townhouse sale price increased by 19.4 per cent to $584,944. Apartment-style property sales increased by 19.8 per cent from February 2019, and the average price increased by 1 per cent.
“Apartment-style properties in Hamilton are the most affordable, with an average price of $346,250. There were also 83 new listings of apartment-style properties, with 54 sales, so the inventory could be building,” says Della-Nebbia. “There are great opportunities within other segments of the market, and that’s where a local RAHB REALTOR® can be instrumental – they know the communities and have the resources to find you your dream property.”
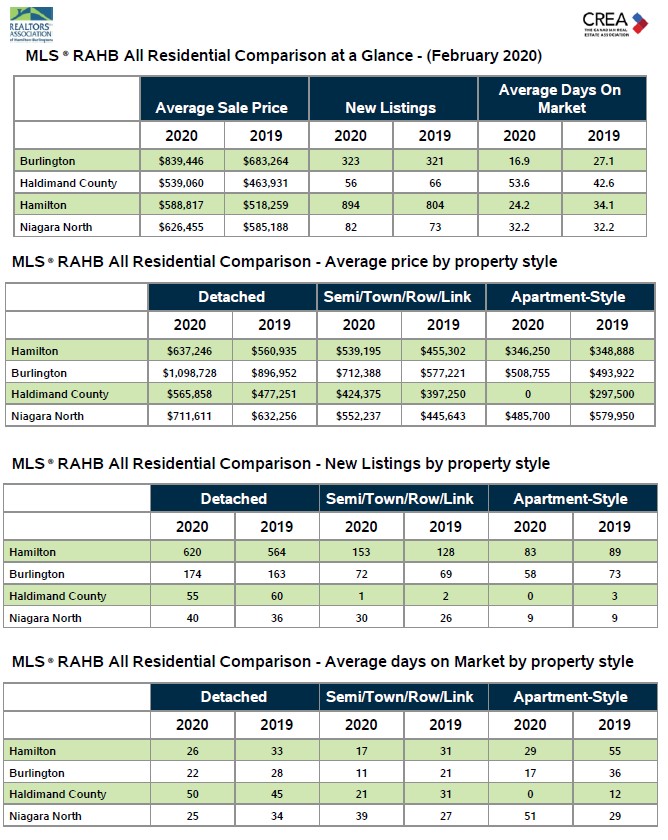
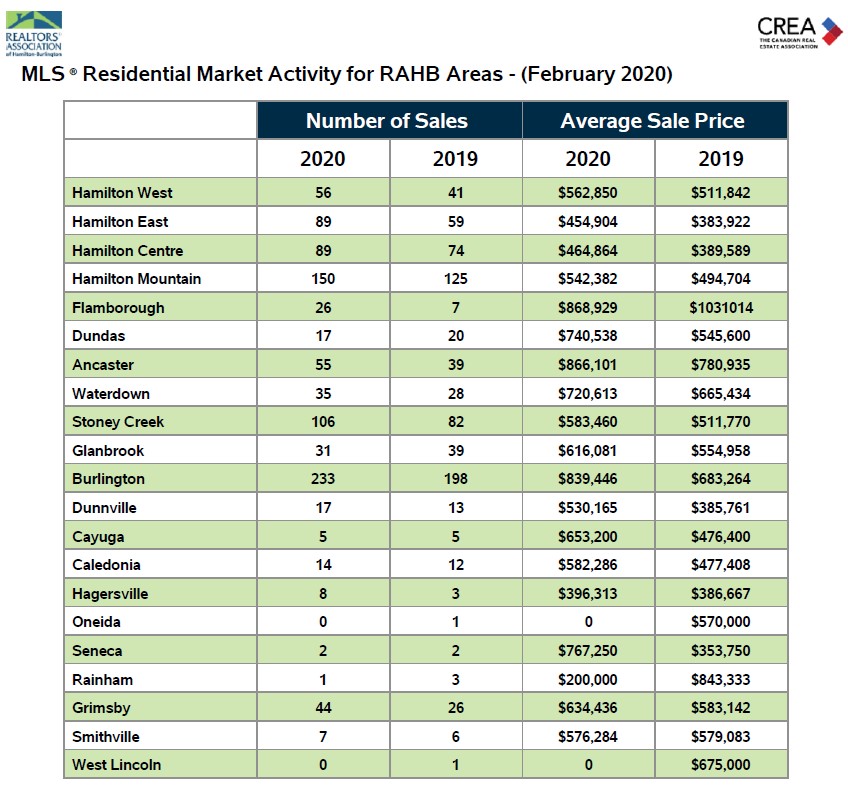
Specific neighbourhoods within the overall RAHB market area see results that often differ from the average of the entire RAHB market area. Because neighbourhoods vary, determining the right price and conditions when buying or selling a property can be challenging. Local RAHB REALTORS® have the experience, knowledge and tools to help buyers and sellers make those big decisions.
– 30 –
- Residential Market Activity Table for RAHB Areas
- RAHB Residential Activity Map
- Residential Market Activity Table for Burlington
- Residential Market Activity Table for Hamilton
- Residential Market Activity Table for Haldimand
- Residential Market Activity Table for Niagara North
- Commercial Market Activity Table for RAHB Areas
*Average sale price can be useful in establishing long-term trends, but should not be used as an indicator that specific properties have increased or decreased in value. Talk to your local REALTOR®.
*Please note: The overall RAHB residential average price is calculated by dividing the sum of all residential sale prices by the total number of residential sales.
